 |

|
|
|

What
is The Survey System
The Survey System is the most complete software package available for working with survey questionnaires. This software is simple enough for occasional users, yet powerful and flexible enough for research professionals. Unlike spreadsheets or general purpose statistics packages, The Survey System was designed specifically for surveys. Version 9.0 reflects over 20 years of experience and the input of thousands of market researchers, political pollsters, human resources managers, customer service staff, health care administrators, educators, product development teams and others in more than 40 countries.
Creative Research Systems achieved this combination of power, speed and simplicity by making The Survey System modular. You only have to buy and learn the modules you need. You can enhance your system by adding modules as your needs expand.
The Survey System handles all types of questionnaires from simple comment cards to the most sophisticated telephone-based interviews. It takes you through all aspects of the survey process from designing and printing a questionnaire through producing professional quality tables and Graphics. You can easily enter and edit the data, spell check the text, calculate complex statistics and necessary sample sizes. We offer telephone sample management and multi-user network support. You can incorporate sound and graphic images into the interviewing process. You can even record respondents' answers in their own voices. This feature makes the most impressive research presentations ever!
The Survey System Saves You
Time
The Survey System is easy to learn and use. It uses standard Windows pull-down menus and dialog boxes. There are no commands to memorize. You can use a mouse or keyboard. One keystroke opens a context-sensitive Help window, which explains your options. There is a Tutorial to get you started.
The Survey System's philosophy is do the work only once, then reuse it. If you already have a questionnaire in the form of a Word .doc file or an .rtf file, you can import it directly into The Survey System. Other time-savers:
- Enter question and answer choice labels only once.
- Use the same instructions to put questions on the screen for data entry and to produce paper or Web page questionnaire forms, tables, text reports and graphics.
- Re-use questions in study after study, without re-typing them.
- Create re-usable custom table, chart and Web questionnaire formats.
Professional Reports
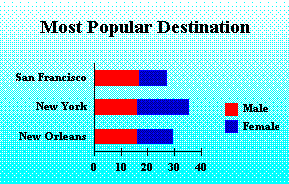
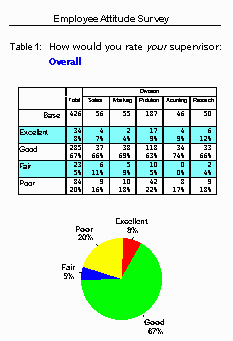
The Survey System's tables are camera-ready for professional presentations. This site features sample tables, charts and other reports produced with this software.
You can produce many different kinds of tables. Most tables can have a "banner" format. A banner is an expansion of the cross-tabbing found in general statistics or database packages. Banners can show answers given by the entire sample and up to 60 sub-groups within the sample on the same page. The Professional Edition produces attractive reports showing the text of responses to open-ended questions.
Many options allow you to customize your reports and enhance their visual
appeal:
- Use different fonts for different parts of reports.
- Frame tables with top and/or bottom lines on each page and gridlines.
- Incorporate a logo or graphic in your tables.
- Change the content and appearance of individual tables or apply changes globally.
- Use different formats to customize the content and appearance of your tables.
- Produce professional quality two- and three-dimensional graphics.
- Show tables and charts on the same page or separately.
- Create basic tables showing the answers to a single question or summary tables showing a series of related questions.
- Rating scales or ranking questions can show Means (averages) or distributions of answers.
- Print questionnaire forms suitable for scanning.
- Edit reports on-screen before printing or export them to other software via the Clipboard or various file formats.

| Return to top | Next -> |
| Home | Products | Services | Downloads | Ordering | Research Aids | Client List | About Us |
|
Copyright © 2004 Creative Research Systems |
|
